EWX: Overview and Use
The Early Warning eXplorer (EWX) is a web-based single-page application for exploration of geospatial data related to drought monitoring and famine early warning. The EWX enables scientists, analysts, and policymakers to view diverse data sets side-by-side in the same spatial bounding box, while also stepping through sequences of multiple time-series data sets. The EWX also allows users to view summary statistics and plots for user-selected regions by administrative zone, crop zone, hydrologic zones, or country. The objective of the EWX is to provide the famine early warning community with a lightweight, customizable web-based GIS client focused on the needs of food security analysts and decision-makers. Key features are listed below, however, new user-friendly features and data sets are being added as the user community and analytical requirements of that community expand. EWX instances are hosted by several different agencies, including:
Climate Hazards Center EWX Viewer: https://ewx3.chc.ucsb.edu/ewx/index.html
EWX Key Features
- Allows access to agroclimatic data sets (e.g., precipitation, temperature, & vegetation)
- Allows a user to compare and contrast different agroclimatic data sets
- Allows downloading of data and maps
- Allows for bulk downloading of time-series
- Allows users to zoom in on their focus domain and extract data for predefined polygons
- Provides data, anomalies, & Z scores
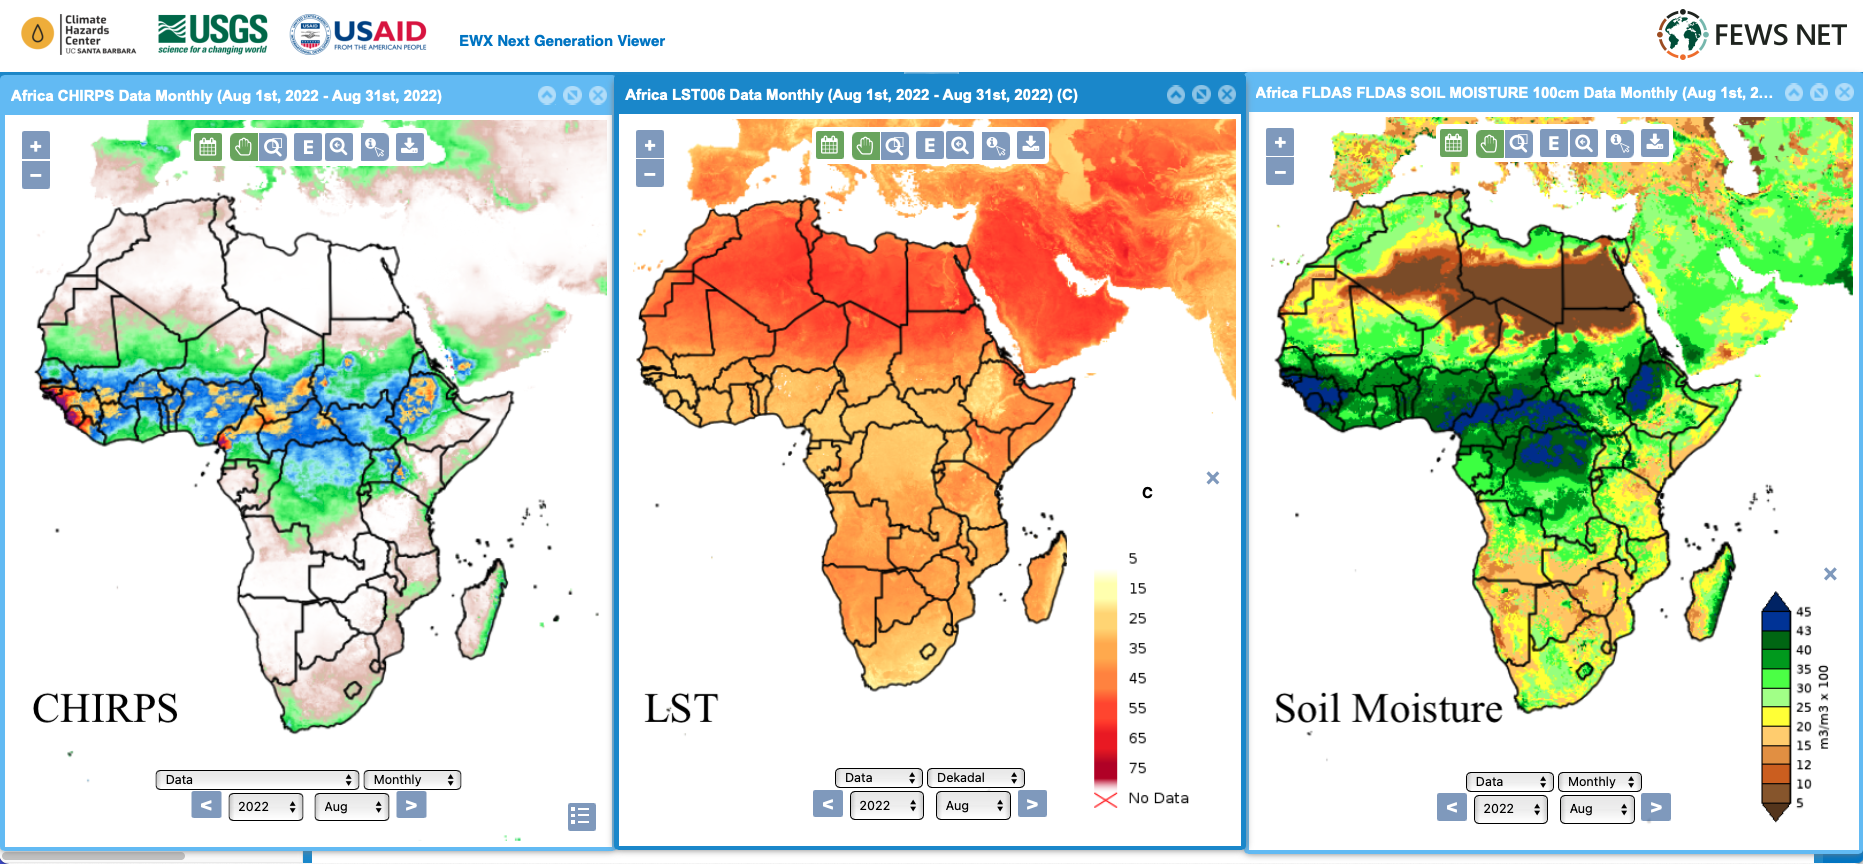
Compare and contrast agroclimatic data sets using EWX. This graphic shows data for three different datasets—CHIRPS rainfall, MODIS Land Surface Temperature, and MODIS NDVI—which were opened using the “Dataset” menu on the left.
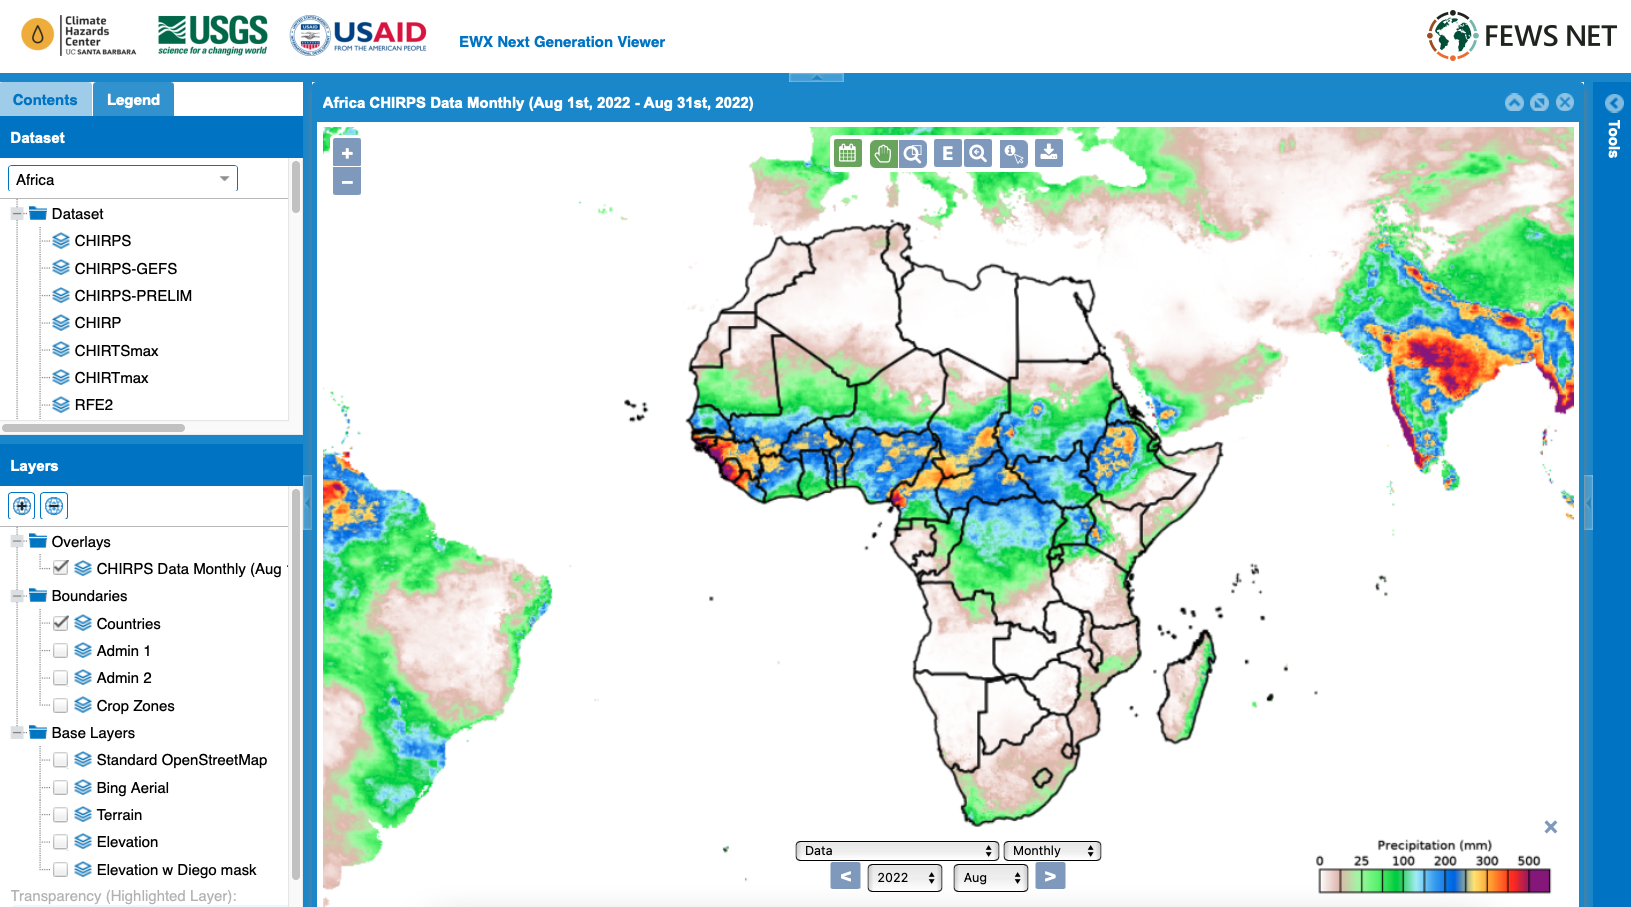
Introduction to EWX Layout and Data Viewing
A. Table of Contents to select data sets
B. Layer Selector to choose boundary base layers to work with; toggle the data layer by selecting the checkboxes
C. Map Panes to display the layers
D. Tools Pane provide detail information and sync individual map panes
E. Region selector to choose which region to work in
F. Content and Legend selector
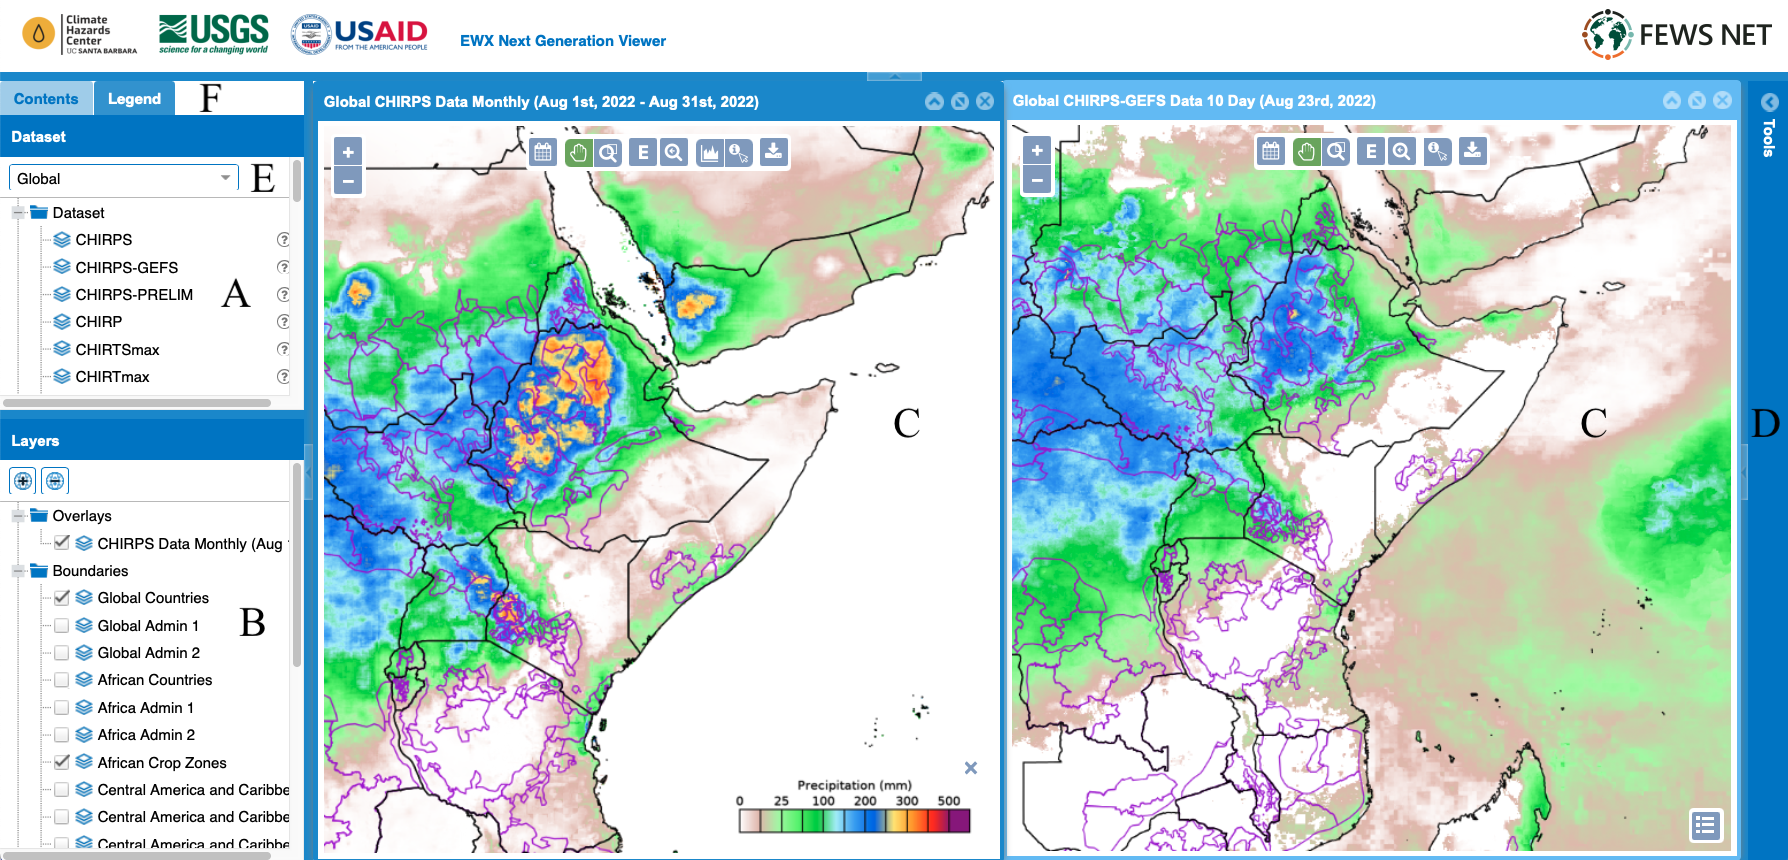
Map Pane Controls
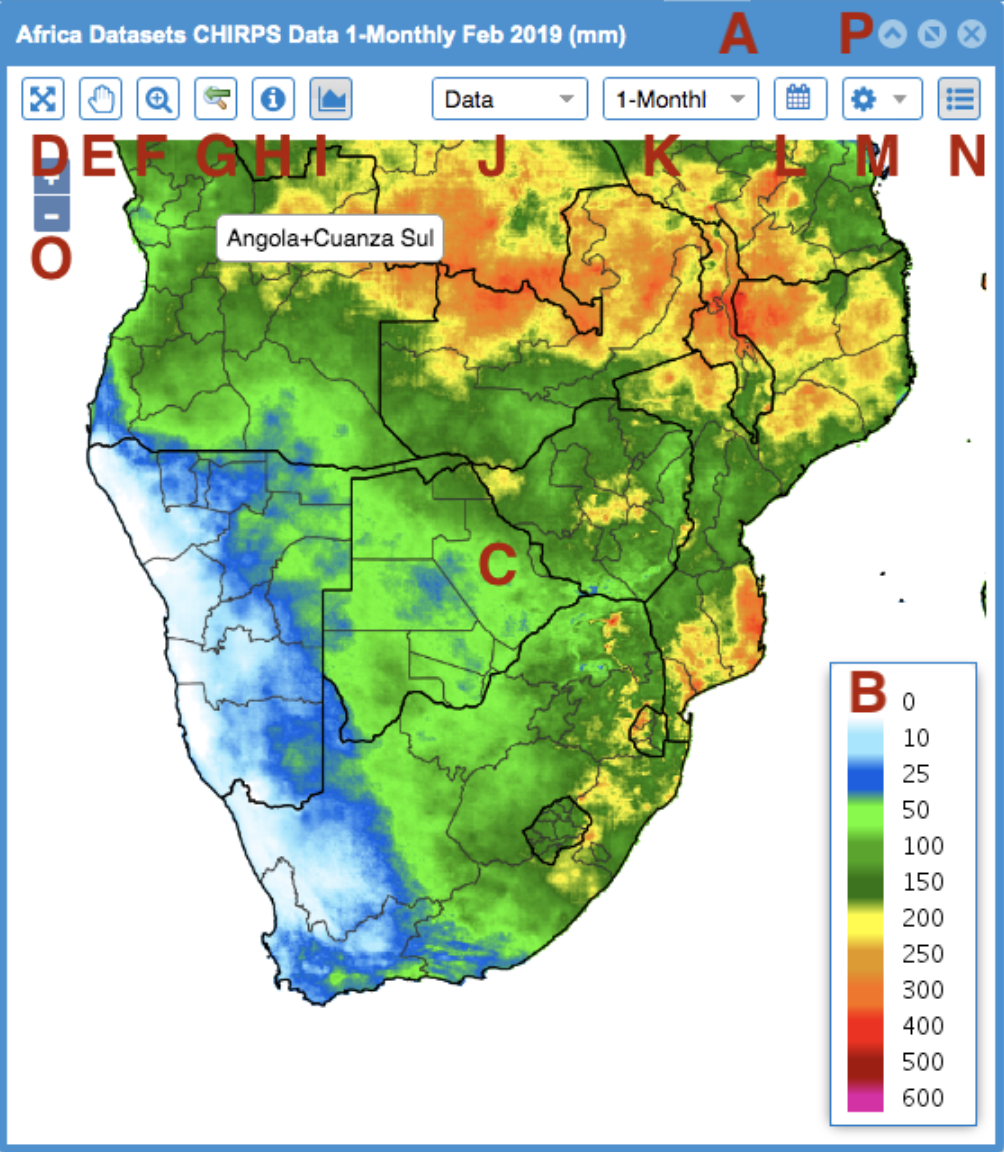
A. Title bar displays data name. type. date and units
B. Legend bar
C. Interactive region polygons. Double click for time series plots
D. Zoom to region button
E. Pan tool to move the map
F. Zoom to extent tool
G. Zoom to previous tool
H. Identify tool to get information on the region polygon
I. Graph tool. Select to plot time series
J. Data type selector
K. Periodicity selector
L. Time period selector
M. Download tool. Download the current image or data.
N. Toggle map legend
O. Zoom controller
P. Minify, maxify, and close map pane selectors
Time-Series Controls
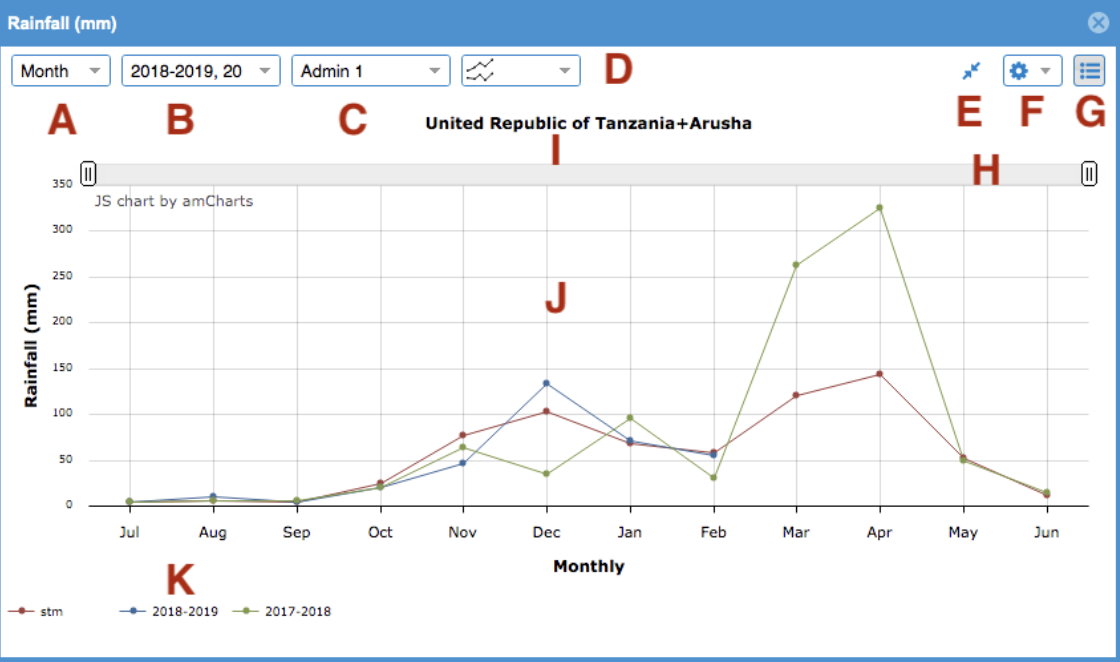
A. Period type selector
B. Season selector
C. Region type indicator
D. Plot type selector
E. Minify selector
F. Download image or data button
G. Toggle legend button
H. Zoom graph tool
I. Plot title
J. Plot pane
K. Interactive season highlighter
Tools Pane Controls
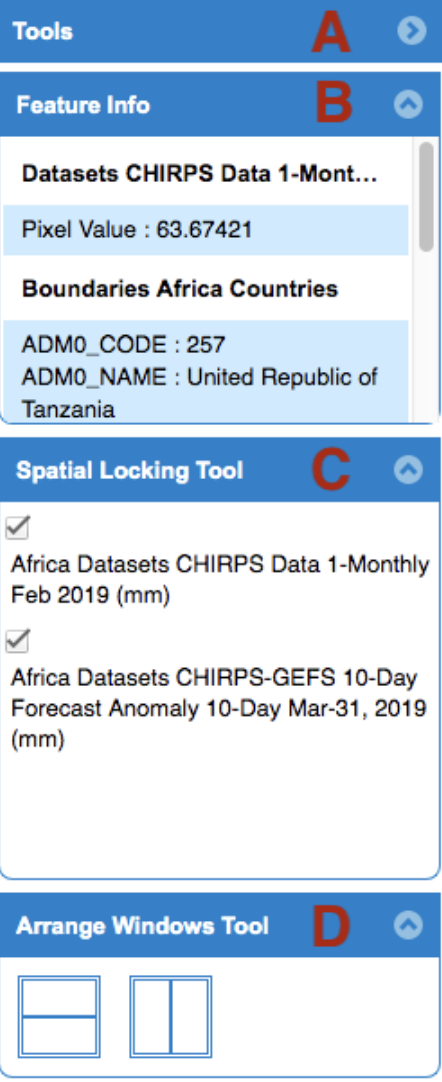
A. Tools pane can be opened in the upper right corner of the EWX
B. Feature information is displayed here after the user clicks on a region.
C. Spatial locking to lock multiple windows together for panning and zooming.
D. Arrange Windows Tool will automatically arrange the current map panes to maximize available space and keep window sizes even.